Simply recoding the time and maybe the 500m splits is not sufficient to really understand how good a performance an individual or crew has delivered.
Until now it has been necessary for teams to employ sports scientist to give them these sorts of insights.
With Ludum we have democratised this ability so that all coaches and athletes can get this sort of insight simply by importing the data they collected when racing.
Now the racing season is underway and you are focusing on your main event, what are you doing to improve how you race?
Maybe you spent the whole of the winter training period measuring your improvement on the ergometer as well as in the weights room? Measuring performance on the water is difficult in rowing, due to factors such as changing conditions including wind speed and water temperature. However, there is still a need to collect and use some meaningful data from water work.
In assessing performance on the water, perhaps the first question to be asked is what is a performance?
It is worth stressing that it is not the same thing as a result. Performance can improve even without a win, and measuring performance regardless of result is key to measuring progress.
Performance can be broken down into several different constituent parts. To judge the level of performance on the water in a race, targets will need to be set for each of the following areas.
- Race Start (start sequence and maximum speed)
- Race Transition (from start sequence into racing rhythm)
- Race Rate and Rate Profile
- Race Pace and Rhythm
- In-Race Efforts (‘pushes’ or ‘burns’)
- Sprint for the Line
Ludum conducted a short case study to look at this issue.
The quality of GPS used for the test did not enabled in-depth race analysis. To achieve such an end, the test would need to use a GPS system such as Catapult (MiniMax). Nonetheless, the test assessed the athletes’ race performance from warm up to finish.


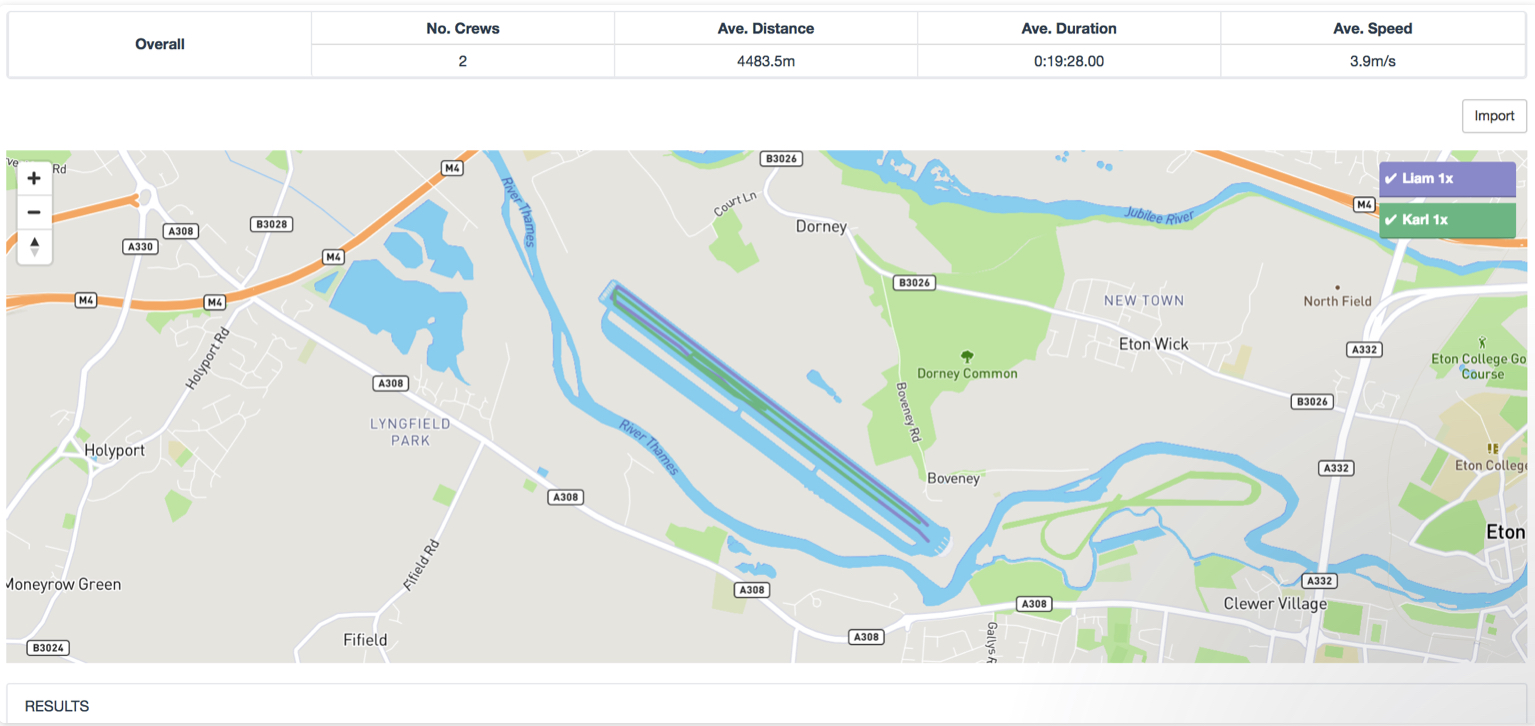
For the warm up, it is easy to assume it was done properly. It may not have been. However, once a coach knows what to look for in the warm up, it is possible to check it is done properly every race. The key is getting the athlete to understand that warming up properly is important, and that it is in their interest to use GPS devices, switching them on and upload the data to your analytics platform. In the Ludum performance analysis system, the coach can see all crews’ GPS data in once place, with no more requirement to look at multiple different data sets on multiple different devices.
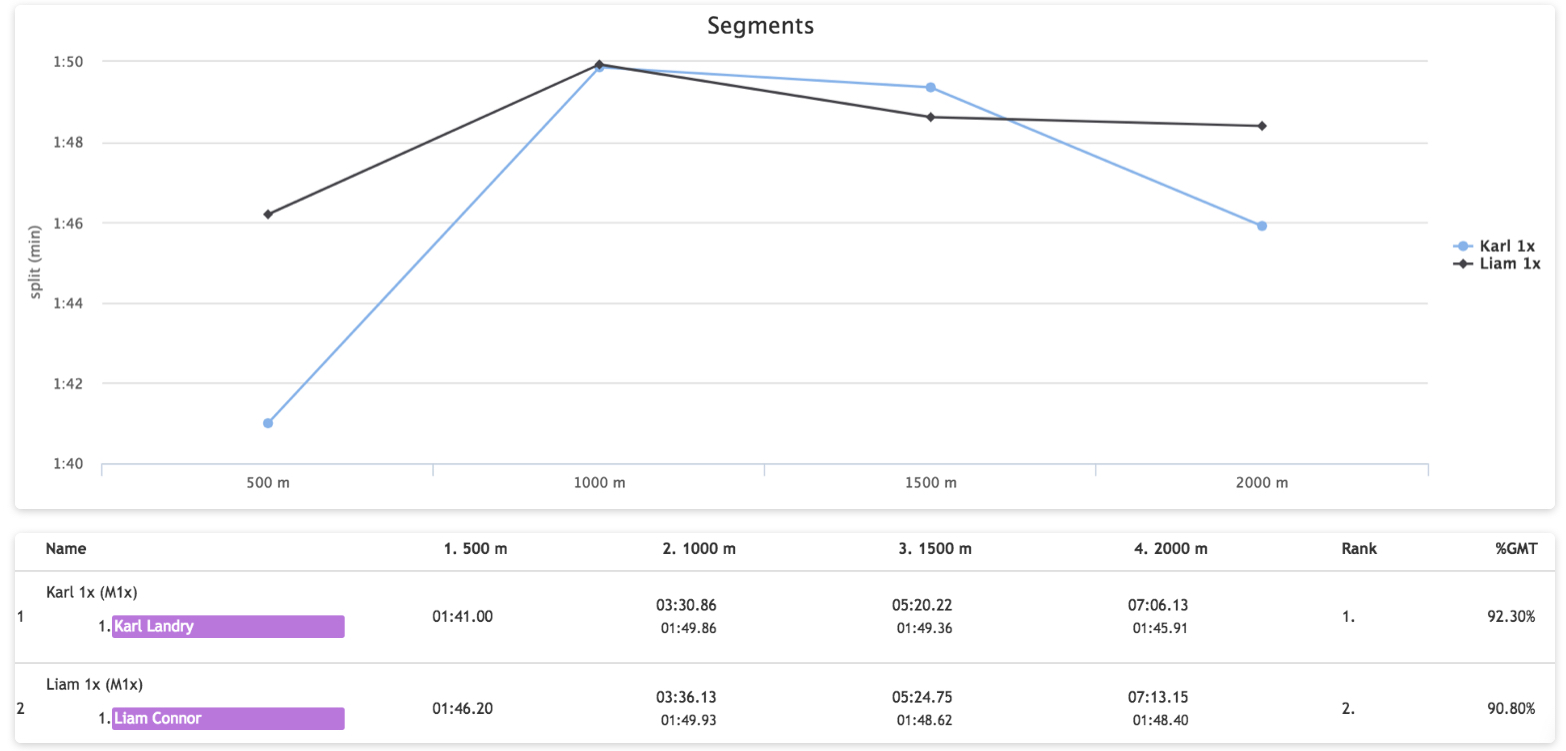
In the case study (for which the names of the athletes have been changed), two single scullers raced over 2000 m. Karl beat Liam by 1.5% (about 7 seconds). The two athletes train together and, from analysis of training performance, we know they are very similar in speed. So, did the result suggest one of them underperformed?
So, what data was collected from the race? GPS from both boats. Heart rate from both boats. Time from both boats, with the pieces timed from alongside the course by the coaches.
After importing the data into the Ludum performance analysis software, the following information was available.
FULL GPS TRACE OF GMT SPEED FOR KARL
Warm up – three short bursts with the third one over 100% of race speed, then a longer piece of about 90 seconds at or about race pace. Karl then did a sprint piece, followed by a steady paddle of almost two minutes. The athlete then paddled straight to the start line.

FULL GPS TRACE OF GMT SPEED FOR LIAM
Warm up – lots of sitting around with three short bursts barely breaking paddling speed, a longer burst which barely reached race pace before seeming to fade away, and then a short amount of paddling followed by sitting around for a bit.

For both scullers, the warm up was very short – assuming they switched the GPS on as soon as they pushed off from the pontoon. However, what did these warm ups lead up to in terms of race performance?
Karl was more explosive out of the start, being 5.2 seconds faster – which was most of the overall race margin. This can be seen in both the pacing and GPS graphs.
KARL’S HEART RATE TRACE
Below is the graph produced in Ludum showing Karl’s warm up and race. His speed trace can be seen in black; his heart rate can be seen in blue. It is possible to observe how quickly the athlete’s heart rate rose: this demonstrated that his metabolism was switched on his body was ready to perform.

LIAM’S HEART RATE TRACE
Below is the graph produced in Ludum showing Liam’s warm up and race. Again, his speed trace can be seen in black; his heart rate can be seen in blue. It is possible to observe that his heart rate was not so responsive – hence indicating that his metabolism was not dynamic enough.

On the back of this kind of information, it is possible to ask some more informed questions about what is going on. The data also provides some objective information around which a coaching team can have useful and structured conversations with athletes. The key is to get the athletes involved in the discussion, and hopefully they will also start asking questions about what they are doing.
Please listen to our Podcast by Caroline MacManus, who subsequently has become the Head Physiologist for Rowing New Zealand.
View more content like this

Technology can Demonstrate Improved Athlete Skills and Performance on the Water
Getting objective data that helps athletes focus on technical queues that coaches give them makes it possible for athletes to get feedback on their technique
Improving Sports Performance by Measuring Power, not Speed
The ultimate measure of performance is usually time. How long does it take to complete a race. Often coaches and athletes use time to measure
What is Ludum? | Using data to improve your sporting performance
The ultimate measure of performance is usually time. How long does it take to complete a race. Often coaches and athletes use time to measure


